LE · Les Écologistes Bloc: Écologistes
In the same bloc
No other candidate of this bloc in the current table.
- 1st-round score
- 3.3% 0.9–7.6
- Qualifies for the 2nd round
- <1%
- Comes first in the 1st round
- <1%
- Wins the election
- <1% <1%
Model, not a poll · spread across scenarios · 80% interval · 1 Nov 2026
Profile
Experimental · automatically generated (local model) from Wikipedia and the press — may contain errors.
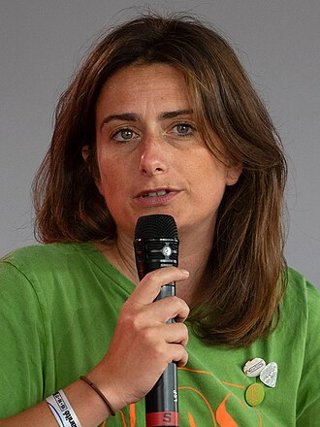
Marine Tondelier, born in 1986, is a French politician who has led the Ecologists party since 2022. A former regional councillor for Hauts-de-France and a local opponent of the National Rally in Hénin-Beaumont, she gained national visibility during the 2024 legislative elections as part of the New Popular Front. She is currently designated as her party's candidate for a potential left-wing primary ahead of the 2027 presidential election.
Strengths
- According to Libération (left), she marks a distancing from La France Insoumise by describing Mao Zedong as a dictator, which is presented as an effective political strategy. Libération Left · 29 Oct 2026
- She achieved significant media exposure and a notable electoral result by leading the Ecologists' list within the New Popular Front during the 2024 legislative elections. Wikipédia
- She maintains a continuity of social and political mobilization, participating in anti-racism rallies and addressing societal issues such as the great replacement theory. TF1 Info · 30 Oct 2026 ; InfosYvelines · 30 Oct 2026
Weaknesses
- According to La Dépêche du Midi (center-left), she faced criticism for presenting already well-known practices of major retail chains as a revelation. La Dépêche du Midi Centre-left · 31 Oct 2026
- A poll reported by Le Parisien (center) indicates that she is among the candidates for whom French voters most frequently refuse to vote. Le Parisien Centre
- According to Frontières, her party is experiencing internal tensions regarding the alliance strategy with La France Insoumise, with some fearing electoral disappearance. Frontières · 30 Oct 2026
Text from Wikipedia (CC BY-SA 4.0)
Polls and trend
Dots: one first-round poll. Line: model average. Band: 80% interval.
How to read this chart. Each dot is a published poll (pollster, end date of fieldwork); the line joins the average score estimated by the model. Hover over a dot to see the pollster and sample size.
Learn more
Polls from different pollsters are not directly comparable: each has its own method and usual bias, which the model corrects in part. The spread between dots on the same day reflects this diversity as much as statistical uncertainty.
View the figures as a table
| Date | Pollster | 1st-round score | n = |
|---|---|---|---|
| 22 Oct 2026 | Cluster17 | 2.5% | 3000 |
| 22 Oct 2026 | Cluster17 | 2.0% | 3000 |
| 22 Oct 2026 | Cluster17 | 2.0% | 3000 |
| 22 Oct 2026 | OpinionWay | 1.0% | 973 |
| 22 Oct 2026 | Ipsos | 3.5% | 1500 |
| 22 Oct 2026 | Ipsos | 3.5% | 1500 |
| 22 Oct 2026 | Ipsos | 3.5% | 1500 |
| 22 Oct 2026 | Ipsos | 3.5% | 1500 |
| 21 Oct 2026 | Harris Interactive | 2.0% | 2094 |
| 21 Oct 2026 | Harris Interactive | 2.0% | 2094 |
| 21 Oct 2026 | Harris Interactive | 2.0% | 2094 |
| 21 Oct 2026 | Harris Interactive | 2.0% | 2094 |
Estimated share and uncertainty fan
Experimental: this block does not feed into the probability of winning. Left of the vertical line: dots are polls, the line is the smoothed median of the estimate, the pale band its 80% interval. Right: the state estimated on the day of the last poll, carried forward 28 days with the same random walk; three nested bands hold 50, 80 and 95% of the draws. It measures the uncertainty of the estimate; it does not announce the vote.
Experimental · does not feed into the probability of winning
- Poll
- Smoothed median
- 80% interval (past)
- 50% fan
- 80% fan
- 95% fan
- Carried-forward median
- last poll
How to read this chart. Horizontal axis: time; vertical axis: the share of voting intentions, in %. Dots are polls, the line is the median of the estimate. After the vertical line the bands widen: the further from the last poll, the less certain the estimate.
Learn more
The three nested bands hold 50, 80 and 95% of the draws of the estimated state, carried forward with the same random walk as the opinion model; they contain neither future polls nor the vote itself. Validation shows this layer's intervals are too narrow: read them as a lower bound on uncertainty. The table under the chart gives the same values as numbers.
View the figures as a table · Fan values
| Days after the last poll | Date | Percentile 2.5 | Percentile 10 | Percentile 25 | Percentile 50 | Percentile 75 | Percentile 90 | Percentile 97.5 |
|---|---|---|---|---|---|---|---|---|
| 0 | 22 Oct | 2.5 | 2.6 | 2.6 | 2.8 | 2.9 | 3.0 | 3.1 |
| 7 | 29 Oct | 2.4 | 2.5 | 2.6 | 2.8 | 2.9 | 3.0 | 3.1 |
| 14 | 5 Nov | 2.4 | 2.5 | 2.6 | 2.8 | 2.9 | 3.0 | 3.2 |
| 21 | 12 Nov | 2.3 | 2.4 | 2.6 | 2.7 | 2.9 | 3.1 | 3.2 |
| 28 | 19 Nov | 2.3 | 2.4 | 2.6 | 2.7 | 2.9 | 3.1 | 3.3 |
Probability of winning, day by day
Line: main scenario. Band: spread across poll scenarios (min–max).
Reconstructed curve: the model replayed day by day on the polls already published. Days without a recent poll are missing.
How to read this chart. The line is the candidate's probability of winning over time, the band its uncertainty interval. It is reconstructed day by day on the polls already published.
Learn more
A falling probability does not say the candidate is "losing": it says that, given the known polls, a smaller share of simulations has them winning. The model knows neither manifestos nor events, only the numbers.
Second-round head-to-heads
How to read this table. Each line pits two candidates against each other in the second round. The first table gives the score of head-to-head polls; the second, the share of simulations in which the first named wins.
Learn more
Head-to-head polls test specific pairs on a given date; the model, for its part, simulates all possible pairs from the first round and vote transfers. The two figures can therefore differ without contradicting each other.
Most likely match-ups according to the model
In the press
What newspapers write is not voter support. None of these figures enters the probability.
How to read this table. The list shows recent articles in which the candidate is mentioned, with headline, outlet and date. Each headline links to the original article.
Learn more
The number of mentions measures press attention, not opinion: an article may be favourable, critical or purely factual, and the site does not judge. The outlets tracked cover the whole spectrum; their list is on the "Press" page.
Mentions : 8
- Présidentielle 2027 : post-partum, allaitement, insultes… Marine Tondelier se confie sur son nouveau quotidien de mère Le Parisien · 31 Oct 2026
- Présidentielle 2027 : Mélenchon, Zemmour, Tondelier… ces candidats pour lesquels les Français refusent le plus de voter, selon un nouveau sondage Le Parisien · 31 Oct 2026
- Présidentielle 2027 : Marine Tondelier croit révéler "un scandale des supermarchés" pourtant déjà connu, elle reçoit une flopée de critiques La Dépêche du Midi · 31 Oct 2026
- Polémique entre Mbappé et la Chine : Marine Tondelier estime que l’attaquant français « a eu entièrement raison » Le Parisien · 31 Oct 2026
- Rendre la théorie du "grand remplacement" illégale ? Les explications de Marine Tondelier sur LCI - TF1 Info TF1 Info · 30 Oct 2026
- Trappes : Mélenchon, Glucksmann, Tondelier… des milliers de personnes attendues ce soir contre le racisme - InfosYvelines InfosYvelines · 30 Oct 2026
- Marine Tondelier partage un hommage rare à son compagnon après la naissance de leur fils Léon - Ohmymag Ohmymag · 30 Oct 2026
- Sur la Chine, Marine Tondelier appuie là où ça fait mal avec les insoumis Libération · 29 Oct 2026
What the markets say
No market quotes this candidate.