Explore the data
Seven ways of looking at the same campaign, all computed from today's data.
The race, with its landmarks
How to read. Probability of winning by day, with the campaign's landmarks: triangles = sourced events, dots = detected events (press spike, large move).
Learn more
The landmarks are of two kinds: events entered by hand with their source (triangles) and moments detected automatically, such as a spike in articles or a large move (dots). A landmark does not explain the curve: it only places a moment in the calendar.
Landmarks on the charts: dated events with a source, and events detected automatically (press spikes, large moves, new scenario).
View the figures as a table — Campaign landmarks
Media attention and polls
How to read. At the top, the candidate's average score in polls; below, the number of articles per day that mention them. The two panels share the time axis but not the scale: look for whether a press spike comes before or after a movement, without concluding a cause.
Learn more
The top panel comes from polls, the bottom one from the press collected; each has its own scale. A spike in articles may come before a movement, follow it, or have no connection: the chart lets you look, not conclude.
View the figures as a table
| Candidate | average score, % | articles (30 j) |
|---|---|---|
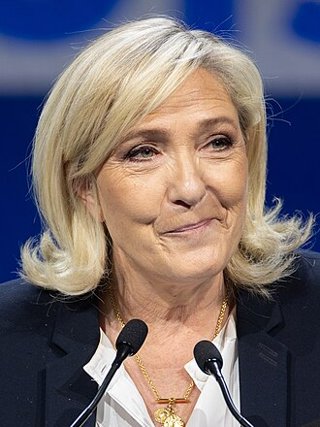 Marine Le Pen |
35.7% | 62 |
 Raphaël Glucksmann |
13.2% | 39 |
 Gabriel Attal |
11.7% | 66 |
 Jean-Luc Mélenchon |
17.2% | 93 |
 Bruno Retailleau |
9.3% | 40 |
 Éric Zemmour |
4.3% | 6 |
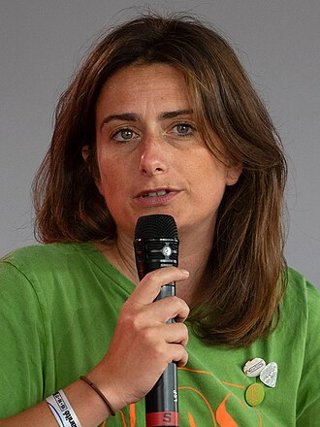 Marine Tondelier |
3.2% | 8 |
 Nicolas Dupont-Aignan |
2.3% | 3 |
Topics × candidates, this week
How to read. Each cell counts the week's articles on a topic for a candidate; the darker the cell, the more there are. Only articles sorted by topic are counted.
Learn more
Topics are assigned automatically from the headline and may be imprecise; an article with no recognised topic is not counted. A dark cell says a topic is very present in the press for a candidate, not that opinion on it is favourable or unfavourable.
26 Oct → 1 Nov 2026
| Candidate | Alliances | Other | Economy | Justice | Polls | Security | Immigration | Pensions | International | Ecology | Europe |
|---|---|---|---|---|---|---|---|---|---|---|---|
| Jean-Luc Mélenchon | 11 | 32 | 7 | 2 | 9 | 1 | 6 | 1 | 1 | ||
| Édouard Philippe | 21 | 5 | 1 | 23 | 2 | 7 | 7 | 1 | |||
| Gabriel Attal | 37 | 6 | 3 | 3 | 3 | 2 | 1 | ||||
| Marine Le Pen | 8 | 10 | 4 | 5 | 11 | 2 | 1 | 1 | 1 | 1 | |
| David Lisnard | 30 | 4 | 1 | 1 | 1 | 1 | 1 | ||||
| Raphaël Glucksmann | 23 | 6 | 3 | 2 | 1 | ||||||
| François Ruffin | 2 | 9 | 14 | 1 | 2 | ||||||
| Bruno Retailleau | 19 | 6 | 1 | 1 | |||||||
| Sarah Knafo | 1 | 9 | 2 | 5 | 1 | 4 | 1 | ||||
| Jordan Bardella | 4 | 8 | 1 | 1 | 1 | 1 | 1 |
Vote transfers from the 1st to the 2nd round
How to read. On the left, each other candidate's 1st-round voters (in points of the vote); on the right, where they go in the 2nd round for the chosen head-to-head. The width of a flow is the average share; error bars give the 80% interval drawn from the 2017 and 2022 elections.
Learn more
The vote transfer is estimated from the 2017 and 2022 elections: it describes an average behaviour, very variable from case to case. It serves as a parameter of the model for second-round head-to-heads; the longer the error bar, the less certain the figure.
Measured vote transfer (2017 and 2022 polls). Assumption: the rate depends on the starting group, not on the opponent.
| Candidate | Jean-Luc Mélenchon | Marine Le Pen | Abstention / blank |
|---|---|---|---|
| Raphaël Glucksmann 13.2% | 8.8 7.6–9.9 | 0.9 0.4–1.5 | 3.5 2.5–4.6 |
| Gabriel Attal 11.7% | 5.9 1.0–10.5 | 5.9 1.2–10.7 | 0.0 0.0–0.0 |
| Bruno Retailleau 9.3% | 4.2 3.4–5.1 | 2.5 1.7–3.2 | 2.6 1.9–3.4 |
| Éric Zemmour 4.3% | 0.4 0.2–0.6 | 3.4 3.1–3.7 | 0.5 0.3–0.8 |
| Marine Tondelier 3.3% | 2.2 1.9–2.5 | 0.2 0.1–0.4 | 0.9 0.6–1.1 |
| Nicolas Dupont-Aignan 2.3% | 0.6 0.4–0.8 | 1.0 0.7–1.2 | 0.7 0.6–0.9 |
| Fabien Roussel 2.2% | 0.9 0.7–1.1 | 0.4 0.3–0.6 | 0.9 0.7–1.1 |
| Others (< 1%) | 0.7 | ||
| Camp total | 40.1 | 49.9 | 9.1 |
pts · 80% interval
What if…? Who runs
How to read. Tick the candidates who run: the chart shows the already-computed scenario that matches this set. Without an exact match, it shows the closest one and says so. Nothing is recalculated in the browser.
Learn more
The scenarios are computed in advance for several possible lists of candidates. They show how each one's probability depends on who runs, without predicting who will.
View the figures as a table
| Scenario | Candidate |
|---|---|
| Main scenario · 17 polls | Pen 35.7% (Wins the election 76%) · Mélenchon 17.2% (Wins the election 5%) · Glucksmann 13.2% (Wins the election 8%) · Attal 11.7% (Wins the election 6%) · Retailleau 9.3% (Wins the election 4%) · Zemmour 4.3% (Wins the election <1%) |
| 16 polls | Pen 35.0% (Wins the election 73%) · Mélenchon 16.7% (Wins the election 5%) · Philippe 16.4% (Wins the election 14%) · Glucksmann 11.9% (Wins the election 6%) · Retailleau 7.3% (Wins the election 2%) · Zemmour 4.1% (Wins the election <1%) |
| 14 polls | Pen 34.3% (Wins the election 74%) · Mélenchon 16.0% (Wins the election 5%) · Philippe 12.9% (Wins the election 9%) · Glucksmann 12.3% (Wins the election 7%) · Retailleau 6.6% (Wins the election 2%) · Attal 5.4% (Wins the election <1%) |
| 3 polls | Pen 31.6% (Wins the election 69%) · Mélenchon 16.7% (Wins the election 6%) · Philippe 15.3% (Wins the election 12%) · Glucksmann 13.2% (Wins the election 8%) · Lisnard 6.3% (Wins the election 2%) · Retailleau 6.2% (Wins the election 2%) |
| 5 polls | Pen 35.5% (Wins the election 74%) · Philippe 17.9% (Wins the election 16%) · Mélenchon 16.7% (Wins the election 5%) · Hollande 8.0% (Wins the election 2%) · Retailleau 7.6% (Wins the election 2%) · Tondelier 5.0% (Wins the election <1%) |
| 3 polls | Pen 35.5% (Wins the election 75%) · Mélenchon 15.7% (Wins the election 5%) · Glucksmann 12.7% (Wins the election 8%) · Philippe 12.2% (Wins the election 8%) · Retailleau 6.1% (Wins the election 1%) · Lisnard 4.9% (Wins the election <1%) |
| 3 polls | Pen 33.8% (Wins the election 76%) · Mélenchon 14.3% (Wins the election 4%) · Glucksmann 11.5% (Wins the election 8%) · Philippe 11.4% (Wins the election 8%) · Retailleau 5.3% (Wins the election 1%) · Attal 5.0% (Wins the election <1%) |
| 3 polls | Pen 36.6% (Wins the election 80%) · Mélenchon 18.1% (Wins the election 5%) · Attal 12.7% (Wins the election 7%) · Retailleau 10.0% (Wins the election 5%) · Hollande 7.3% (Wins the election 2%) · Zemmour 5.0% (Wins the election <1%) |
| 3 polls | Pen 35.3% (Wins the election 76%) · Mélenchon 17.0% (Wins the election 5%) · Attal 15.8% (Wins the election 11%) · Retailleau 10.6% (Wins the election 6%) · Tondelier 5.5% (Wins the election <1%) · Faure 5.2% (Wins the election <1%) |
| 3 polls | Pen 34.6% (Wins the election 71%) · Philippe 21.5% (Wins the election 20%) · Mélenchon 16.4% (Wins the election 5%) · Retailleau 7.6% (Wins the election 2%) · Tondelier 5.4% (Wins the election <1%) · Faure 4.6% (Wins the election <1%) |
| 3 polls | Pen 34.2% (Wins the election 75%) · Mélenchon 16.4% (Wins the election 5%) · Philippe 15.5% (Wins the election 14%) · Attal 7.8% (Wins the election 2%) · Retailleau 7.1% (Wins the election 2%) · Tondelier 4.9% (Wins the election <1%) |
Model versus market
How to read. Solid line: the model's probability; dashed lines: prediction-market quotes. The grey band is the ±8 point noise around the model: a market inside the band does not contradict the model.
Learn more
Prediction markets are platforms where money is staked on an outcome; the price reads as a probability. The grey band of ±8 points is an arbitrary but constant noise margin, to avoid reading a gap where there is none.
View the figures as a table
| Candidate | Model | Market | Gap |
|---|---|---|---|
| Marine Le Pen | 76% | 36%–51% | +33.1 pts |
| Raphaël Glucksmann | 8% | 4%–6% | +3.4 pts |
| Gabriel Attal | 6% | <1%–6% | +3.5 pts |
| Jean-Luc Mélenchon | 5% | 8%–15% | −6.9 pts |
| Bruno Retailleau | 4% | <1% | +3.6 pts |
| Éric Zemmour | <1% | <1%–1% | −0.2 pts |
±8 pts
Pollster effects
How to read. Average gap of each pollster from the weighted consensus, in points (dot = observed gap, line = 80% interval, diamond = value kept by the model after shrinkage). To the right of zero: the pollster gives the candidate more than the others.
Learn more
Pollster bias is computed on all past polls. The diamond shows the value the model keeps after "shrinkage": a gap observed on few polls is pulled towards zero, because it may be due to chance.
View the figures as a table
| Pollster | Pen | Glucksmann | Attal | Mélenchon | Retailleau | Zemmour |
|---|---|---|---|---|---|---|
| Cluster17 (2) | −3.3 pts −4.8…−1.8 | +1.0 pts −0.8…2.8 | +0.4 pts −1.4…2.3 | +1.9 pts 0.9…2.9 | +0.6 pts −0.5…1.8 | −0.4 pts −1.0…0.2 |
| Harris Interactive (4) | −0.3 pts −1.4…0.8 | −0.9 pts −2.2…0.4 | −0.1 pts −1.4…1.2 | +0.7 pts −0.0…1.4 | +0.1 pts −0.8…0.9 | +1.3 pts 0.9…1.7 |
| Ifop (3) | +1.1 pts −0.1…2.3 | +2.6 pts 1.1…4.0 | +1.6 pts 0.1…3.1 | −1.5 pts −2.3…−0.7 | −1.6 pts −2.5…−0.6 | −1.3 pts −1.8…−0.8 |
| Ipsos (3) | −1.9 pts −3.1…−0.7 | +1.4 pts −0.0…2.9 | −0.3 pts −1.8…1.2 | −1.5 pts −2.3…−0.7 | +1.4 pts 0.4…2.3 | +0.1 pts −0.4…0.6 |
| Odoxa (1) | +2.3 pts —…— | −2.5 pts —…— | −0.7 pts —…— | +0.8 pts —…— | −0.3 pts —…— | +0.1 pts —…— |
| OpinionWay (2) | +0.7 pts −0.8…2.2 | +2.4 pts 0.6…4.2 | −0.3 pts −2.1…1.6 | −2.7 pts −3.6…−1.7 | +0.1 pts −1.1…1.3 | −0.4 pts −1.0…0.2 |
| YouGov (2) | +0.8 pts −0.7…2.4 | −0.2 pts −2.0…1.6 | −0.8 pts −2.6…1.1 | −2.2 pts −3.2…−1.2 | −0.1 pts −1.3…1.1 | −0.1 pts −0.7…0.5 |