Marine Le Pen leads with about 36% in the first round (19–49%)
Marine Le Pen wins the election (second round included) in 76% of the model's simulations, range 69–80% depending on which polls are used. 168 days to the first round, on 18 Apr 2027.
-
1
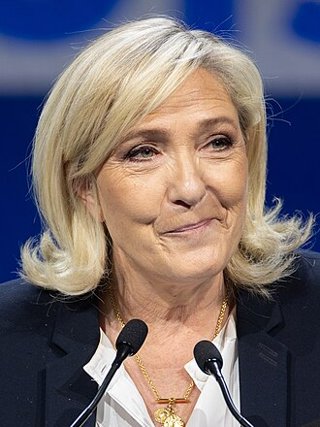 Marine Le Pen RN
36% 19–49%
Wins the election: 76% · first in round 1: 73%
-
2
 Jean-Luc Mélenchon LFI
17% 7–29%
Wins the election: 5% · first in round 1: 13%
- 3 Raphaël Glucksmann PP 13% 5–23% Wins the election: 8% · first in round 1: 6%
-
4
 Gabriel Attal RE
12% 4–21%
Wins the election: 6% · first in round 1: 5%
-
5
 Bruno Retailleau LR
9% 3–17%
Wins the election: 4% · first in round 1: 2%
-
6
 Éric Zemmour R!
4% 1–9%
Wins the election: <1% · first in round 1: <1%
-
7
 Marine Tondelier LE
3% <1–8%
Wins the election: <1% · first in round 1: <1%
-
8
 Nicolas Dupont-Aignan DLF
2% <1–6%
Wins the election: <1% · first in round 1: <1%
Probability of winning the election
Line: main scenario. Band: spread across poll scenarios (min–max).
Reconstructed curve: the model replayed day by day on the polls already published. Days without a recent poll are missing.
How to read this chart. Each line tracks the share of the model's simulations in which the candidate comes first; the band around the line is the uncertainty interval. Hover over or touch the curve to read a date.
Learn more
The probability is not a poll: it says in what proportion of computer draws the candidate wins, given the published polls and their usual error. The curve is reconstructed by replaying the model, day after day, with only the polls known that day, without looking ahead. A wide band means the estimate is uncertain; two overlapping bands do not allow us to say who is ahead.
View the figures as a table
| Date | Marine Le Pen | Raphaël Glucksmann | Gabriel Attal | Jean-Luc Mélenchon | Bruno Retailleau |
|---|---|---|---|---|---|
| 1 Nov 2026 | 76% | 8% | 6% | 5% | 4% |
| 25 Oct 2026 | 75% | 8% | 6% | 5% | 4% |
| 18 Oct 2026 | 74% | 9% | 7% | 5% | 3% |
| 11 Oct 2026 | 75% | 7% | 7% | 6% | 4% |
| 4 Oct 2026 | 73% | 8% | 9% | 5% | 4% |
| 27 Sep 2026 | 73% | 8% | 9% | 6% | 4% |
| 20 Sep 2026 | 71% | 9% | 9% | 6% | 4% |
| 13 Sep 2026 | 70% | 6% | 2% | 6% | 2% |
| 6 Sep 2026 | 69% | 7% | 3% | 5% | 1% |
| 30 Aug 2026 | 69% | 7% | 3% | 5% | 1% |
| 23 Aug 2026 | 75% | 6% | 10% | 5% | 3% |
| 5 Aug 2026 | 69% | 6% | 11% | 8% | 5% |
| 29 Jul 2026 | 69% | 6% | 11% | 8% | 5% |
| 22 Jul 2026 | 69% | 4% | 3% | 5% | 3% |
| 15 Jul 2026 | 69% | 4% | 3% | 5% | 3% |
| 8 Jul 2026 | 71% | 6% | 13% | 5% | 4% |
| 5 Jun 2026 | 64% | 7% | 15% | 5% | 8% |
| 29 May 2026 | 64% | 7% | 15% | 5% | 8% |
| 2 May 2026 | 53% | 8% | 15% | 10% | 12% |
| 25 Apr 2026 | 59% | 9% | 11% | 10% | 7% |
| 7 Apr 2026 | 59% | 9% | 11% | 10% | 7% |
| 31 Mar 2026 | 59% | 9% | 11% | 10% | 7% |
| 11 Mar 2026 | 56% | 6% | — | 6% | 8% |
| 4 Mar 2026 | 56% | 6% | — | 6% | 8% |
| 13 Nov 2025 | 63% | 8% | 12% | 9% | 4% |
| 6 Nov 2025 | 63% | 8% | 12% | 9% | 4% |
| 21 Oct 2025 | 57% | 11% | 10% | 13% | 7% |
| 14 Oct 2025 | 57% | 11% | 10% | 13% | 7% |
| 7 Oct 2025 | 57% | 11% | 10% | 13% | 7% |
| 30 Sep 2025 | 55% | 12% | — | 9% | 4% |
| 2 Jun 2025 | 40% | — | — | 10% | 16% |
| 26 May 2025 | 40% | <1% | — | 10% | 16% |
| 19 May 2025 | 41% | 4% | — | 12% | 8% |
| 2 May 2025 | 46% | 5% | — | 6% | <1% |
| 25 Apr 2025 | 46% | 5% | — | 6% | <1% |
| 18 Apr 2025 | 46% | 5% | — | 6% | <1% |
| 11 Apr 2025 | 49% | 5% | — | 6% | <1% |
| 4 Apr 2025 | 49% | 5% | — | 6% | <1% |
| 28 Mar 2025 | 62% | — | 25% | 8% | — |
| 18 Dec 2024 | 53% | — | — | 6% | — |
| 11 Dec 2024 | 53% | — | — | 6% | — |
| 22 Sep 2024 | 64% | — | 3% | 6% | — |
| 15 Sep 2024 | 64% | — | 3% | 6% | — |
| 22 Jul 2024 | 43% | — | 38% | 15% | — |
| 15 Jul 2024 | 43% | — | 38% | 15% | — |
| 8 Jul 2024 | 43% | — | 38% | 15% | — |
| 26 Apr 2024 | — | — | — | 8% | — |
| 19 Apr 2024 | — | — | — | 8% | — |
| 12 Apr 2024 | 52% | — | — | 7% | — |
| 5 Apr 2024 | 52% | — | — | 7% | — |
| 9 Feb 2024 | 56% | — | <1% | 5% | — |
| 2 Feb 2024 | 56% | — | <1% | 5% | — |
| 19 Jan 2024 | 52% | — | — | 7% | — |
| 12 Jan 2024 | 52% | — | — | 7% | — |
| 4 Nov 2023 | 56% | — | — | 14% | — |
| 28 Oct 2023 | 56% | — | — | 14% | — |
| 15 Sep 2023 | 44% | — | — | 16% | — |
| 8 Sep 2023 | 44% | — | — | 16% | — |
| 25 Apr 2023 | — | — | — | 15% | — |
| 18 Apr 2023 | — | — | — | 15% | — |
| 11 Apr 2023 | 43% | — | — | 14% | — |
| 4 Apr 2023 | 56% | — | — | 21% | — |
Today's ranking
Score: average of polls corrected for pollster biases, with 80% interval.
| Candidate | 1st-round score | 2nd round | Wins the election | 7 days | |
|---|---|---|---|---|---|
| Marine Le Pen |
35.7% 18.5–49.0 | 90% | 76% 69–80% | +1 pts | |
| Jean-Luc Mélenchon |
17.2% 7.2–28.7 | 46% | 5% 4–6% | = | |
| Raphaël Glucksmann | 13.2% 5.2–23.4 | 28% | 8% 6–8% | = | |
| Gabriel Attal |
11.7% 4.4–21.3 | 21% | 6% <1–11% | = | |
| Bruno Retailleau |
9.3% 3.4–17.5 | 12% | 4% 1–6% | = | |
| Éric Zemmour |
4.3% 1.3–9.4 | 2% | <1% <1% | = | |
| Marine Tondelier |
3.3% 0.9–7.6 | <1% | <1% <1% | = |
spread across scenarios · 80% interval.
How to read this table. One line per candidate. The large figure is the estimated first-round score (model median) with its 80% interval. Next come the probability of reaching the second round and, in grey, the probability of winning the election (second round included) with its range; the short line shows that range, the dot the central value. Last column: the change over 7 days.
Learn more
The first-round score is an estimate drawn from polls, corrected for each pollster's usual bias; it is not a result. The probability of winning also depends on second-round vote transfers, which are themselves uncertain. The order follows the estimated first-round score, never a ranking of merit. The "scenario" menu shows what a different choice of retained polls gives.
What changed in 7 days
25 Oct 2026 → 1 Nov 2026
-
Marine Le Pen goes up to 76% (+1 pts in 7 days).
— biggest factor : Ageing of polls (+0.5 pts)
Why? Full detail
Probability of winning: 75.2% → 75.7% (+0.5 pts) in 7 days. First-round share: 35.7% → 35.7% (0 pts).
What the move is made of
Factor Probability First-round share Ageing of polls +0.5 pts 0 pts Total +0.5 pts 0 pts Ageing: with no new poll, the old ones count for less and less. Their weight is halved every 14 days, and a poll older than 60 days leaves the calculation. Over this period it moves the probability by +0.5 pts and the share by 0 pts.
Vote transfers: the second-round matrix is the same on both dates, so it plays no part in this move. In 21% of the simulations the final pair has no head-to-head poll: the model then estimates the transfers.
In the press meanwhile
57 articles (previous period: 5) · Topics : Polls 11, Alliances 8, Justice 5, Economy 4
- Présidentielle 2027 : Marion Maréchal affirme qu’elle sera « évidemment présente » dans la campagne de Marine Le Pen et dément toute tension avec Jordan Bardella - Frontières Frontières · 31 Oct
- Présidentielle 2027 : un magistrat honoraire conteste l’éligibilité de Marine Le Pen, elle saisit le Conseil supérieur de la magistrature Le Parisien · 31 Oct
- Mélenchon, Le Pen et Glucksmann progressent, le centre recule… ce que disent les sondages des dernières semaines, candidat par candidat Le Parisien · 31 Oct
This is context. It does not mean the press caused the move.
Some of it is chance. A gap under 2 points of probability (or 0.5 point of share) stays within the noise of the simulations and of rounding. The current share is estimated between 18.5% and 49.0% (80% interval). This move is inside that zone: read it with care.
-
Jean-Luc Mélenchon : 5% (=)
- Raphaël Glucksmann : 8% (=)
-
Gabriel Attal : 6% (=)
-
Bruno Retailleau : 4% (=)
How to read this table. Each line compares today's probability with the one from 7 days ago. Under the line, click "Why?" to see the detail: which polls came in or dropped out, what the ageing of polls does, and what the press was writing.
Learn more
A gap of less than a point can just be the luck of the simulations, so we do not push it forward. If nothing is above the threshold, the page says so. Articles are context, not the cause. For slower movements, switch to 30 days.
Model versus markets
Betting markets give another reading. The gap is not a demonstrated error: markets have their own biases and their liquidity is low.
kalshi, manifold (play money), smarkets
| Candidate | Model | Market | Gap | |
|---|---|---|---|---|
| Marine Le Pen |
76% | 41% | +35 pts gap to be explained | |
| Raphaël Glucksmann | 8% | 4% | +4 pts within the noise | |
| Gabriel Attal |
6% | <1% | +5 pts within the noise | |
| Jean-Luc Mélenchon |
5% | 8% | −3 pts within the noise | |
| Bruno Retailleau |
4% | <1% | +4 pts within the noise | |
| Éric Zemmour |
<1% | <1% | = within the noise | |
 Fabien Roussel |
<1% | <1% | = within the noise |
Model Market · * thin market
How to read this chart. For each candidate: the solid dot is the model's probability, the empty circle is the quote of a betting market, and the line joining them is the gap between the two.
Learn more
The two figures do not measure the same thing. The model starts from polls; the market aggregates money stakes, with its own biases and sometimes thin liquidity (flagged with an asterisk). A gap does not indicate which of the two is right, and this site takes no side: it puts the two next to each other.
Why not 100%
168 days before the vote, polls have in the past been off by several points. The model replays the first round 20 000 times applying this historical error, then simulates the second.
The calibration rests on two elections (2017, 2022): it is a sanity check, not a validation.
When no second-round poll exists for a match-up, the model simulates a synthetic transfer of votes: 21% of the main scenario's probability rests on it.