Opinion: estimate of latent support
Experimental
Experimental. This layer is experimental and does not feed into the probability of winning. In rolling validation, the 80% intervals cover about 73% of the held-out polls (target: 80%).
Latent support over time
Experimental. Daily median of the estimate (line) and 80% interval (band), in % of voting intentions, over the period covered by the polls. Candidates in alphabetical order. This is a share of the vote, not a probability of winning.
Experimental
How to read this chart. Each line is the daily median of the estimate of a candidate's latent support; the band around it is the 80% interval. On the right, the name and latest value. Hover over the chart to read a date. The "Latent support" table further down gives the same values at the latest date.
Learn more
Between two polls, the estimate is interpolated by the model: a smooth line does not mean there was a measurement every day. The intervals are still too narrow (see the method). This layer is experimental and does not feed into the probability of winning.
Small multiples
Experimental. The candidates with a fixed colour on the site, in alphabetical order, on the same vertical scale (0 to 40%) and the same period (24 Apr to 22 Oct). Line: smoothed median; band: 80% interval. The figure is the last median.
Experimental · does not feed into the probability of winning
 Gabriel Attal
 Raphaël Glucksmann
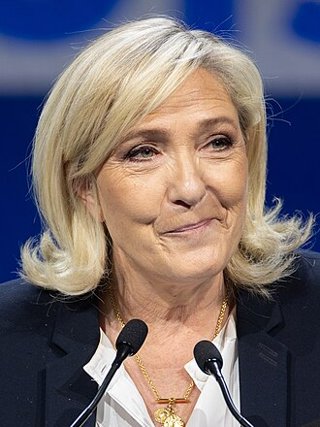 Marine Le Pen
 Jean-Luc Mélenchon
 Édouard Philippe
 Bruno Retailleau
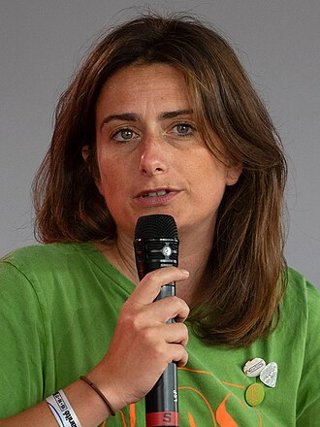 Marine Tondelier
How to read this chart. Every small chart uses the same vertical scale and the same period, so slopes and levels can be compared at a glance. The figure under the name is the last estimated median.
Learn more
The selection does not depend on the figures: these are the candidates with a fixed colour on the site, in alphabetical order. The other candidates appear in the full chart above. The pale band is the 80% interval; it is narrower than reality, as validation shows.
Latent support
Estimate of latent support for each candidate from published first-round polls, based on 36 polls between 24 Apr 2025 and 22 Oct 2026. Candidates are listed alphabetically.
Median share and 80% interval (10th to 90th percentile) of the estimated state on the date of the latest poll, in % of voting intentions.
| Candidate | Median | 80% interval | Latest poll | Polls |
|---|---|---|---|---|
| Bruno Retailleau | 6.8 % | 6.5 – 7.1 % | 22 Oct 2026 | 36 |
| Édouard Philippe | 13.4 % | 13.0 – 13.8 % | 22 Oct 2026 | 33 |
| Éric Zemmour | 4.2 % | 4.0 – 4.5 % | 22 Oct 2026 | 35 |
| Fabien Roussel | 2.1 % | 1.9 – 2.2 % | 22 Oct 2026 | 36 |
| Gabriel Attal | 4.7 % | 4.2 – 5.3 % | 22 Oct 2026 | 27 |
| Jean-Luc Mélenchon | 16.6 % | 16.3 – 17.0 % | 22 Oct 2026 | 36 |
| Marine Le Pen | 34.1 % | 33.6 – 34.6 % | 22 Oct 2026 | 36 |
| Marine Tondelier | 2.7 % | 2.6 – 2.9 % | 22 Oct 2026 | 35 |
| Nathalie Arthaud | 0.7 % | 0.6 – 0.8 % | 22 Oct 2026 | 36 |
| Nicolas Dupont-Aignan | 2.1 % | 2.0 – 2.2 % | 22 Oct 2026 | 33 |
| Raphaël Glucksmann | 12.5 % | 12.1 – 13.0 % | 22 Oct 2026 | 36 |
House effects
Estimated systematic gap of each polling firm, in percentage points, relative to all firms. A positive value means the firm measures this candidate higher on average.
| Pollster | Polls | Bruno Retailleau | Édouard Philippe | Éric Zemmour | Fabien Roussel | Gabriel Attal | Jean-Luc Mélenchon | Marine Le Pen | Marine Tondelier | Nathalie Arthaud | Nicolas Dupont-Aignan | Raphaël Glucksmann |
|---|---|---|---|---|---|---|---|---|---|---|---|---|
| Cluster17 | 6 | +0.5 pts | +2.4 pts | −0.3 pts | −0.2 pts | −0.4 pts | +1.3 pts | −3.2 pts | −0.6 pts | 0 pts | +0.6 pts | +0.1 pts |
| Elabe | 3 | +0.4 pts | −0.6 pts | −0.3 pts | +0.1 pts | −0.5 pts | −1.3 pts | +0.3 pts | +0.3 pts | +0.2 pts | +0.2 pts | +1.3 pts |
| Harris Interactive | 8 | −0.3 pts | −0.7 pts | +0.9 pts | −0.2 pts | −0.1 pts | +0.6 pts | +1.0 pts | −0.3 pts | +0.1 pts | −0.2 pts | −0.8 pts |
| Ifop | 5 | −0.3 pts | −0.2 pts | −0.5 pts | +0.3 pts | +1.6 pts | −0.9 pts | −0.5 pts | −0.1 pts | −0.1 pts | −0.3 pts | +0.9 pts |
| Ipsos | 4 | +0.1 pts | −0.5 pts | +0.1 pts | +0.3 pts | −0.7 pts | −0.6 pts | −0.2 pts | +0.7 pts | −0.1 pts | −0.1 pts | +1.2 pts |
| Odoxa | 2 | −0.8 pts | +1.8 pts | +0.1 pts | −0.1 pts | +0.1 pts | +0.4 pts | +0.9 pts | 0 pts | −0.1 pts | −0.2 pts | −2.2 pts |
| OpinionWay | 6 | +0.2 pts | +0.2 pts | −0.4 pts | 0 pts | −0.2 pts | −0.6 pts | +1.0 pts | +0.2 pts | 0 pts | −0.1 pts | −0.1 pts |
| YouGov | 2 | +0.1 pts | −2.4 pts | +0.4 pts | +0.3 pts | +0.5 pts | −0.4 pts | +1.4 pts | +1.1 pts | 0 pts | +0.2 pts | −1.2 pts |
Blue: the institute measures lower than the whole on average; orange: higher. The shade follows the size of the gap (one scale for the table, up to ±3.2 pt); the value is always written out.
How to read this table. One row per institute, one column per candidate. Each cell gives the institute's estimated gap, in points. Orange: the institute measures higher than the whole; blue: lower; neutral cell: a gap near zero.
Learn more
The colour is only a reading aid: the sign and the value are always printed, and the shade follows one scale for the whole table. An institute gap is an estimated regularity, not a fault: it is used to correct polls before combining them.
Method
The model tracks, day by day, the true support for each candidate, which is never observed directly: only polls measure it, with noise. It is a Kalman filter: with each new poll the estimate moves a little, less so when the poll is small or the pollster departs from the others. Shares are transformed with an additive log-ratio (ALR), which guarantees that shares stay positive and add up to 100%.
The house effect is the systematic gap of a pollster (data collection method, weighting, question wording) from the average of pollsters. The model estimates it and removes it before combining polls.
The intervals are still too narrow: in rolling validation (each poll is predicted using earlier polls only), the 80% interval contains about 73% of the observed results, not 80%. Polls contain errors that the model does not fully describe (fieldwork date, weighting, the list of candidates offered). These intervals should therefore be read as too optimistic. This page is for information only and is not a voting recommendation.