Candidates
1st-round score · 2nd round · Wins the election
These figures are the output of a model applied to published polls. They are not a voting intention, nor a poll within the meaning of the law of 19 July 1977.
How to read this table. The table gives, for each candidate, the estimated first-round score with its 80% interval, the probability of reaching the second round, then the probability of winning the election with its range.
Learn more
All candidates are treated in the same way: same columns, same colours, same size. The order follows the estimated first-round score. The names listed under the table ("Other candidates tracked") are those for which the model has no estimate; their page exists too.
| Candidate | Party | 1st-round score | 2nd round | Wins the election | |
|---|---|---|---|---|---|
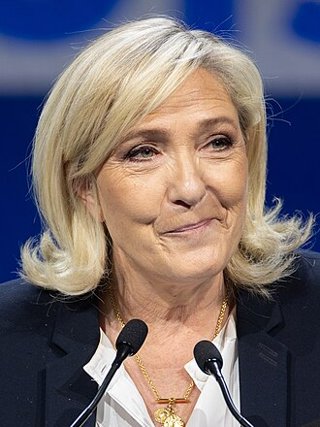 Marine Le Pen |
RN | 35.7% 18.5–49.0 | 90% | 76% 69–80% | |
 Jean-Luc Mélenchon |
LFI | 17.2% 7.2–28.7 | 46% | 5% 4–6% | |
 Raphaël Glucksmann |
PP | 13.2% 5.2–23.4 | 28% | 8% 6–8% | |
 Gabriel Attal |
RE | 11.7% 4.4–21.3 | 21% | 6% <1–11% | |
 Bruno Retailleau |
LR | 9.3% 3.4–17.5 | 12% | 4% 1–6% | |
 Éric Zemmour |
R! | 4.3% 1.3–9.4 | 2% | <1% <1% | |
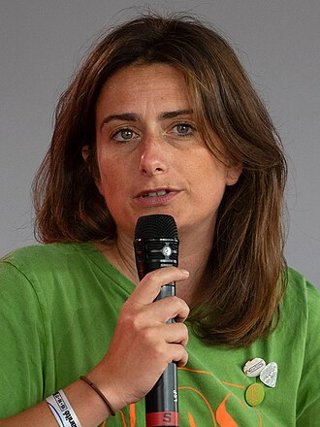 Marine Tondelier |
LE | 3.3% 0.9–7.6 | <1% | <1% <1% | |
 Nicolas Dupont-Aignan |
DLF | 2.3% 0.6–5.6 | <1% | <1% <1% | |
 Fabien Roussel |
PCF | 2.2% 0.6–5.5 | <1% | <1% <1% | |
 Nathalie Arthaud |
LO | 0.7% 0.1–2.3 | <1% | <1% <1% | |
Other candidates tracked
Bernard Cazeneuve, Bruno Le Maire, David Lisnard, Dominique de Villepin, Florian Philippot, François Hollande, François Ruffin, Jean Lassalle, Jordan Bardella, Laurent Wauquiez, Olivier Faure, Philippe Poutou, Philippe de Villiers, Sandrine Rousseau, Sarah Knafo, Xavier Bertrand, Yannick Jadot, Édouard Philippe