First- and second-round polls
Each line links to its source. Gaps between pollsters (house effects) are estimated by the model and removed before averaging.
For each poll: the pollster, fieldwork dates, sample size, client, method and the notice of the Commission des sondages, when this information exists in our sources. "Not given" means the source consulted does not provide it; the original record, reachable through the link, prevails. The model's figures are not polls.
Polls over time
One dot per first-round poll (raw published value). Line: the model's median estimate, after correcting for house effects. Candidates in alphabetical order.
The chart shows all first-round polls; the filters below apply only to the table.
How to read this chart. Each dot is a first-round poll, at the value published by the pollster; the line of the same colour is the model's median estimate for that candidate. Hover over a dot to see the pollster, the date and the sample.
Learn more
The gap between a dot and the line comes partly from house effects, which the model estimates and corrects, and from sampling error. A single dot is not a trend: only the line summarises all the polls. Candidates are chosen with the buttons, in alphabetical order.
Polls
229 polls · 31 Mar 2023 → 22 Oct 2026
How to read this table. Each line is a published poll: pollster, fieldwork dates, sample size, then the score of each candidate tested. A dot (·) means the candidate was not tested.
Learn more
The client, the method and the link to the notice filed with the Commission des sondages are shown on a poll when the source gives them; otherwise one "not given" line above the list says so, instead of repeating it on every row. Second-round head-to-heads are listed apart, one card per pollster, with every pair tested. The filters let you keep only one pollster, one round or one period.
1st round
| Pollster | Fieldwork | Sample | Le Pen | Glucksmann | Attal | Mélenchon | Retailleau | Zemmour | Tondelier | Dupont-Aignan | Source |
|---|---|---|---|---|---|---|---|---|---|---|---|
| Ifop | 30 Mar–31 Mar 2023 | 1105 | 31.0 | · | · | 22.0 | · | 6.0 | · | 3.0 | notice table |
| Ifop | 30 Mar–31 Mar 2023 | 1105 | 32.0 | · | · | 20.0 | · | 6.0 | 1.0 | 3.0 | notice table |
| Ifop | 30 Mar–31 Mar 2023 | 1105 | 35.0 | · | · | 20.0 | · | 7.0 | 2.0 | 4.0 | notice table |
| Ifop | 30 Mar–31 Mar 2023 | 1105 | 36.0 | · | · | 20.0 | · | 7.0 | 1.0 | 3.0 | notice table |
-
Ifop 30 Mar–31 Mar 2023 · n=1105
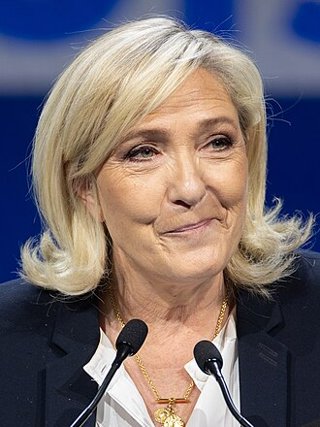 Marine Le Pen31.0
 Édouard Philippe28.0
 Jean-Luc Mélenchon22.0
 Éric Zemmour6.0
 Laurent Wauquiez4.0
 Nicolas Dupont-Aignan3.0
 Jean Lassalle2.5
 Philippe Poutou2.5
 Nathalie Arthaud1.0
-
Ifop 30 Mar–31 Mar 2023 · n=1105
- Marine Le Pen32.0
- Jean-Luc Mélenchon20.0
 Bruno Le Maire18.0
- Éric Zemmour6.0
 Fabien Roussel6.0
- Laurent Wauquiez6.0
- Nicolas Dupont-Aignan3.0
- Jean Lassalle2.5
- Philippe Poutou2.5
- Olivier Faure2.0
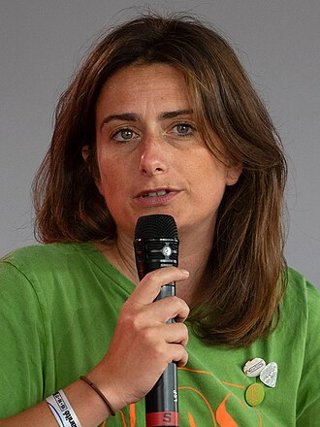 Marine Tondelier1.0
- Nathalie Arthaud1.0
-
Ifop 30 Mar–31 Mar 2023 · n=1105
- Marine Le Pen35.0
- Jean-Luc Mélenchon20.0
- Gérald Darmanin11.0
- Laurent Wauquiez8.0
- Éric Zemmour7.0
- Fabien Roussel5.0
- Nicolas Dupont-Aignan4.0
- Olivier Faure3.0
- Philippe Poutou2.5
- Jean Lassalle2.0
- Marine Tondelier2.0
- Nathalie Arthaud0.5
-
Ifop 30 Mar–31 Mar 2023 · n=1105
- Marine Le Pen36.0
- Jean-Luc Mélenchon20.0
- Laurent Wauquiez10.0
- François Bayrou9.0
- Éric Zemmour7.0
- Fabien Roussel6.5
- Jean Lassalle3.0
- Nicolas Dupont-Aignan3.0
- Olivier Faure2.0
- Philippe Poutou1.5
- Marine Tondelier1.0
- Nathalie Arthaud1.0
House effects
Average gap of each pollster from the consensus, in points, after regularisation. Positive: the pollster gives the candidate more than the average.
How to read this table. Each line is a pollster; each cell, the average gap between its results for a candidate and the weighted consensus, in points. A plus sign means a score usually higher than the consensus.
Learn more
This gap (pollster bias) can come from the method, the mode of interviewing or the weighting; it says nothing about the pollster's intentions. The model corrects part of it, with caution when the pollster has few polls.
| Pollster | Le Pen | Glucksmann | Attal | Mélenchon | Retailleau | Zemmour | Tondelier | Dupont-Aignan |
|---|---|---|---|---|---|---|---|---|
| Cluster17 | −1.9 | +0.1 | 0.0 | +2.1 | 0.0 | −0.3 | −0.6 | +1.0 |
| Harris Interactive | −0.1 | −0.7 | 0.0 | +1.1 | 0.0 | +1.2 | −0.5 | −0.2 |
| Ifop | +0.8 | +0.9 | 0.0 | −0.8 | 0.0 | −1.0 | −0.3 | −0.5 |
| Ipsos | −1.1 | +0.2 | 0.0 | −0.6 | 0.0 | +0.2 | +0.4 | −0.2 |
| Odoxa | +1.1 | −0.7 | 0.0 | +1.1 | 0.0 | +0.2 | +0.1 | −0.2 |
| OpinionWay | +0.5 | +0.6 | 0.0 | −1.6 | 0.0 | −0.2 | −0.1 | −0.2 |
| YouGov | +0.6 | −0.3 | 0.0 | −1.3 | 0.0 | 0.0 | +1.0 | +0.4 |